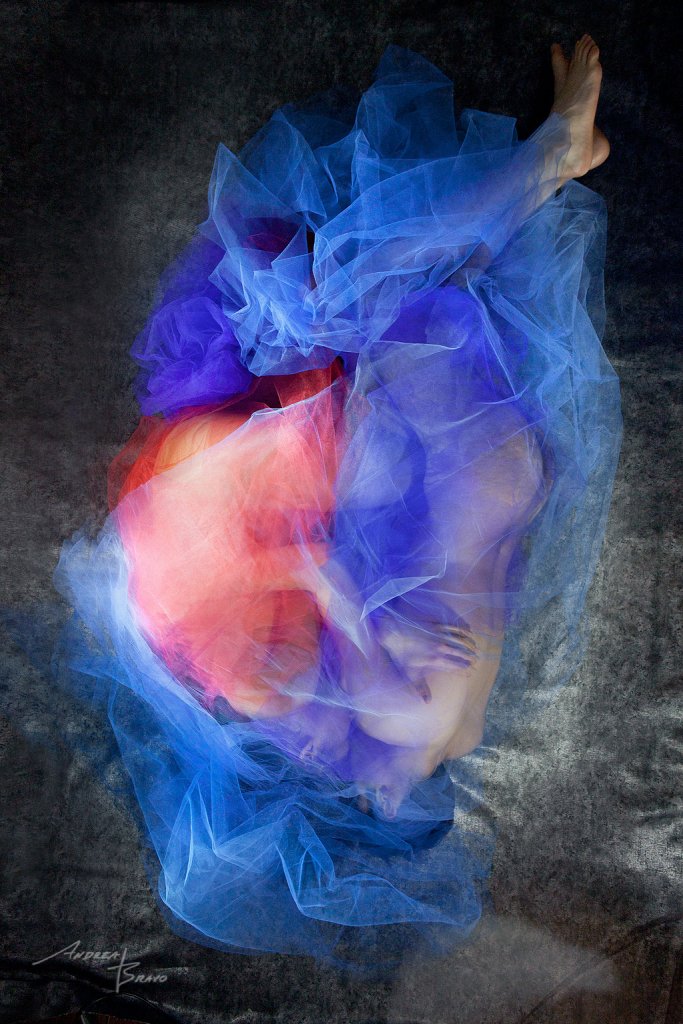
HeartGraphics
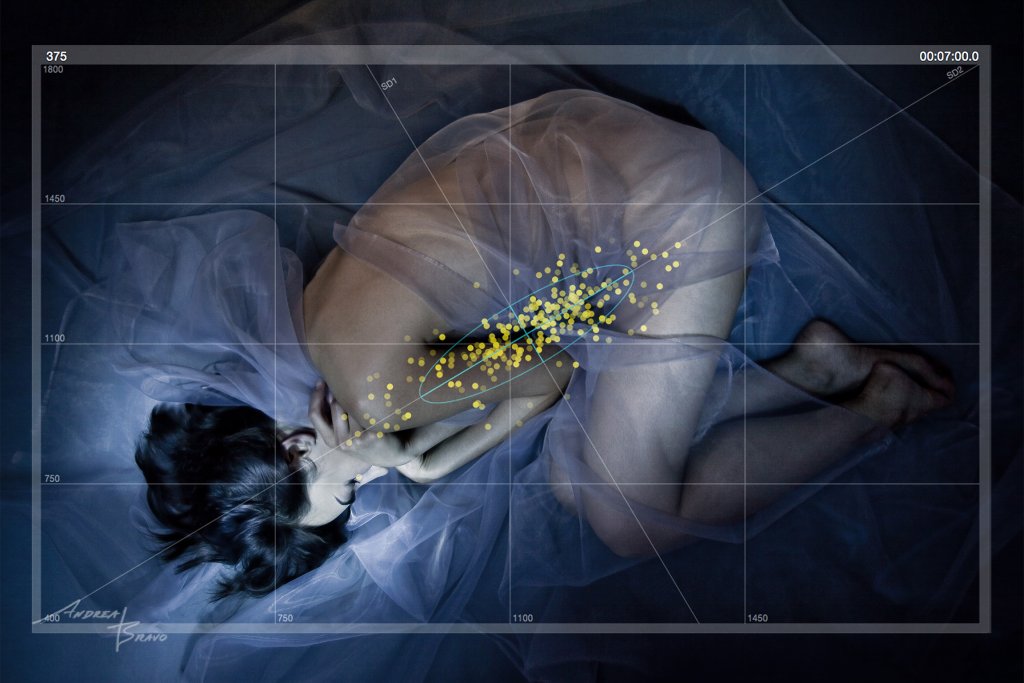
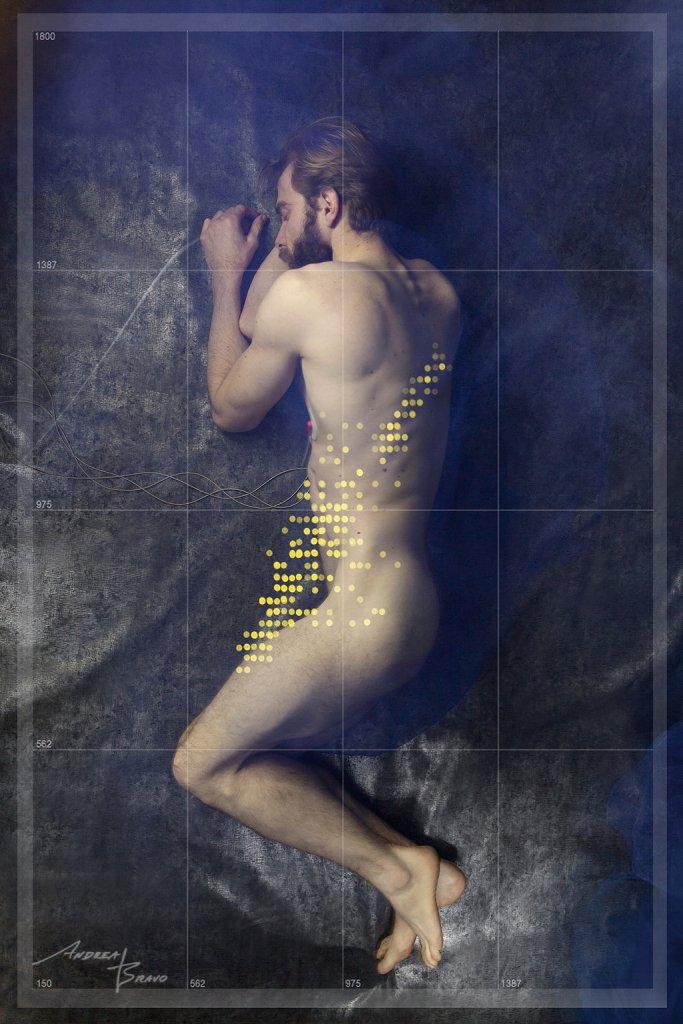
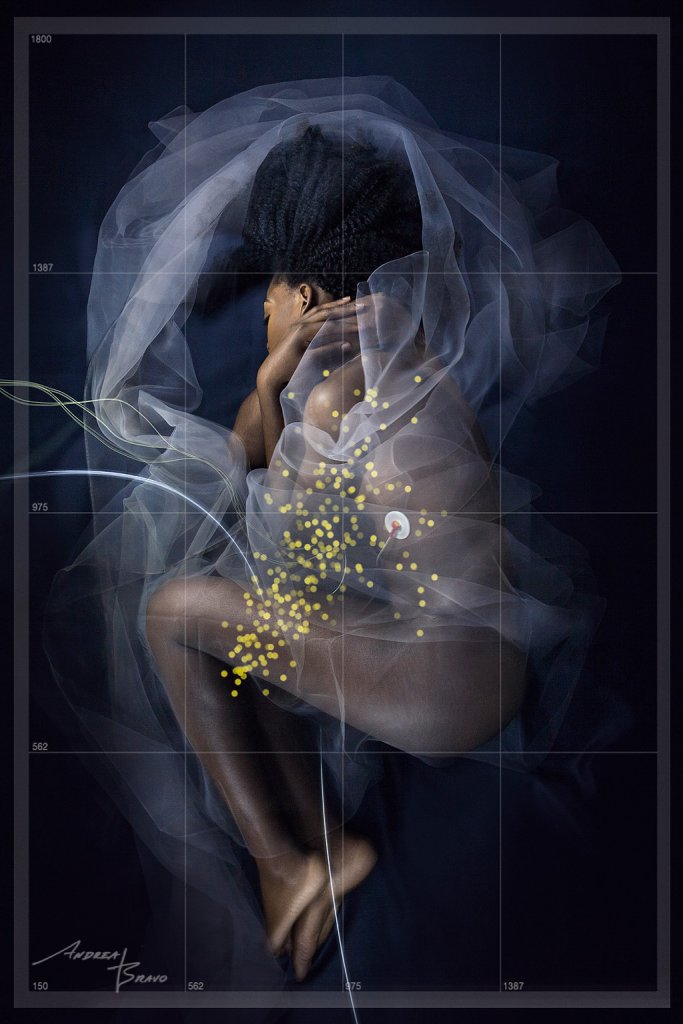
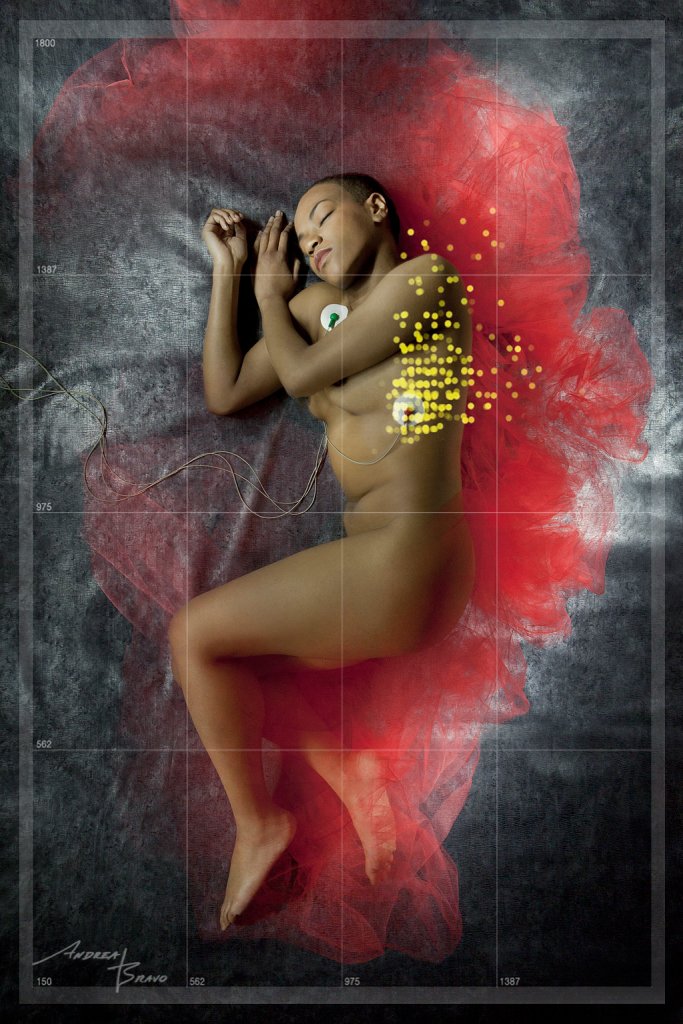
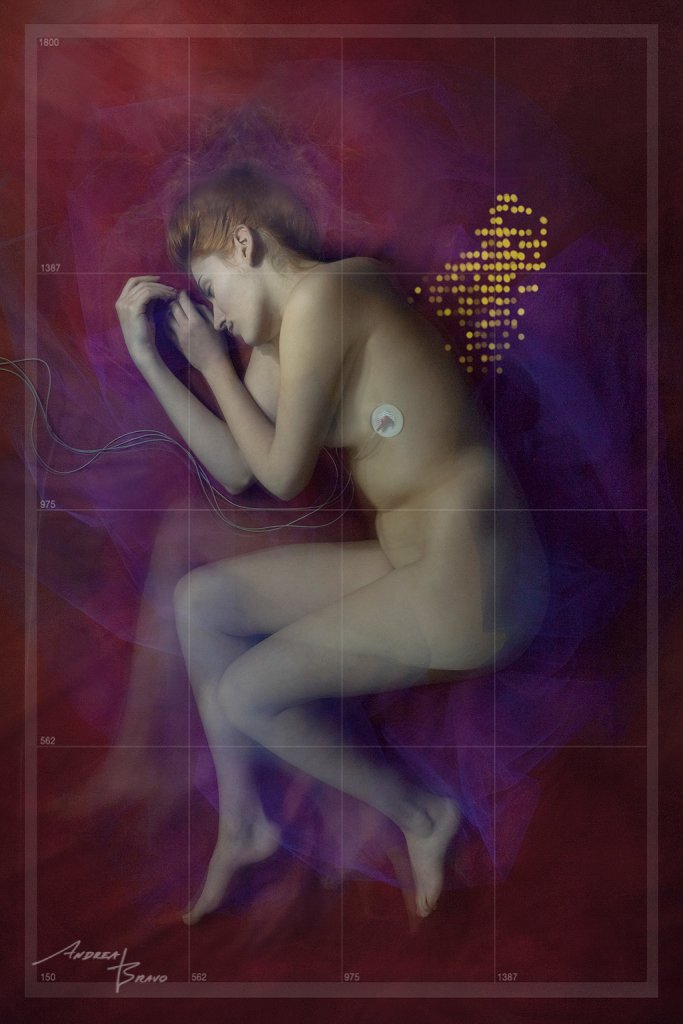
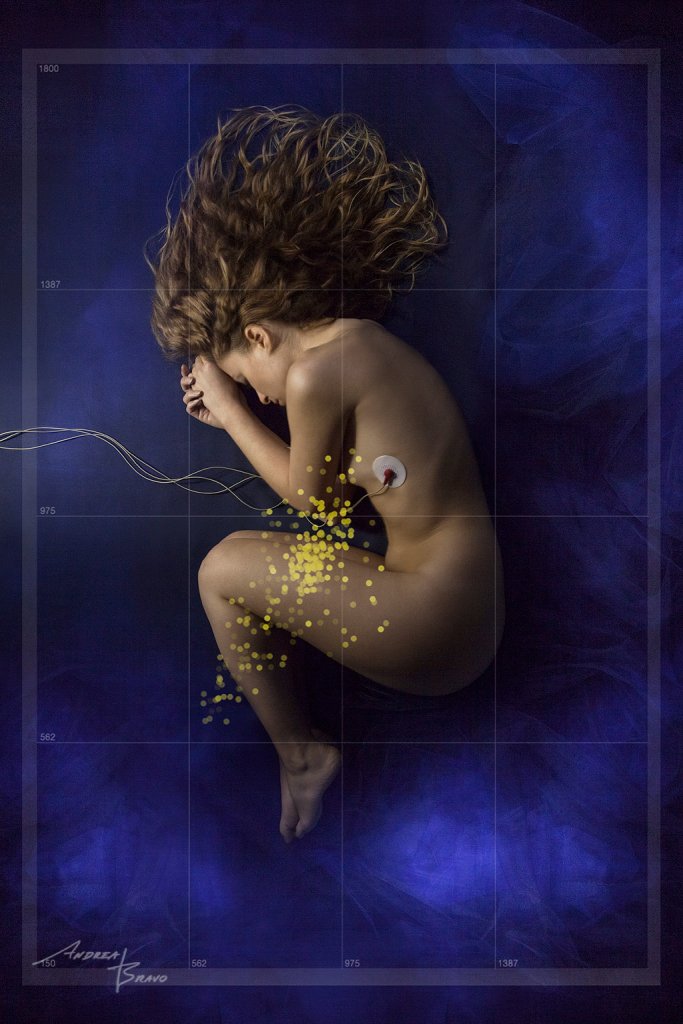
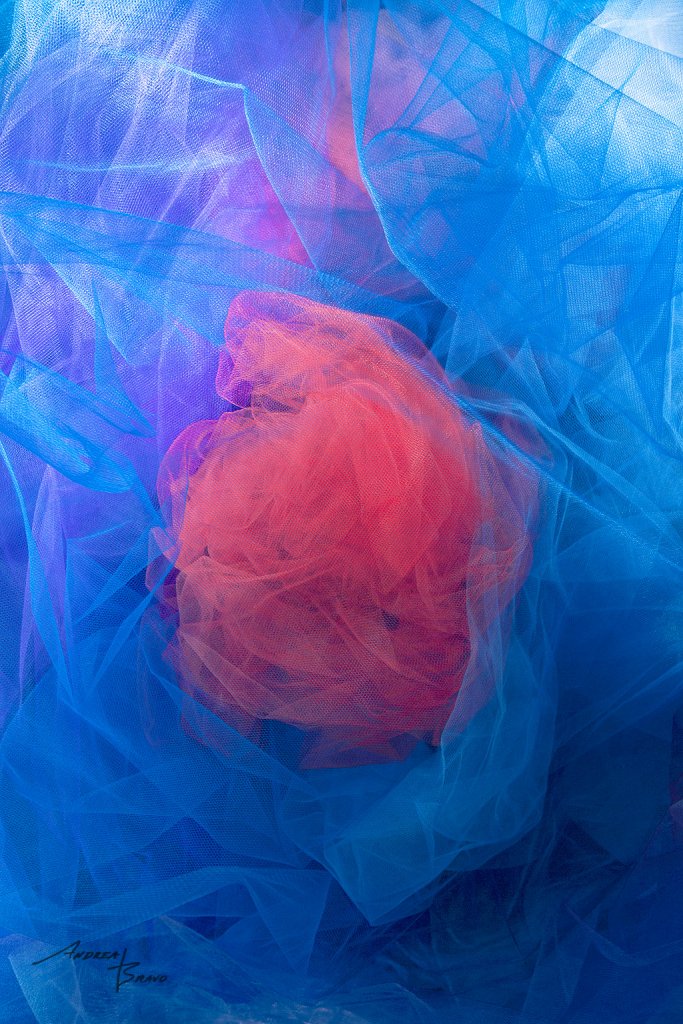
Heartgraphics series (2015-2016) | Paris. Lightpainting photograph and Heart Rate Variability (HRV) data from the model.
The series depicts a subjective/objective vision of the individual, merging data and photography, science and art in a single image.
We live in an era with increasing connectedness. Advances in healthcare technology enable to map the biorhythms of the individuals and get a further understanding of the events happening inside our bodies. For the project, I am using a biofeedback sensor collecting data from the heart named Heart Rate Variability (HRV). The yellow points are data that indicate the interval between two heartbeats.
A larger area of yellow points indicate a greater cardiac rhythm variability and therefore a better capacity of regulation during rest. This means that the body can counterbalance situations, and better regulate stress to achieve a state of calm when the area of yellow points is larger. To the contrary, condensed points indicate that the heart is beating at a uniform rhythm and cannot adapt to restore the body to a state of calm.